Monitor iOS apps: The Sentry way
How to get off on the right foot!

Hi everyone, I'm Mattia, an Italian mobile and full stack developer. I got my computer science master degree in 2019 and from 2017 I'm collaborating with the University of Studies of Turin and Milan (Italy) in the field of visual and motor accessibility. My main work is in the field of computer consulting in an Italian company where I work on mobile (native and cross-platform) and web app
Has it ever happened to you that a customer call and says: "The app crashes"?
You start wonder why and you ask the client what he was doing when app crashes. If you're lucky he remembers and you've a point to start with. I did it for a while, but it was a mess and time consuming and when the bugs seems went away, here they come again.
Out there there are many services for app monitoring and in my company we decided to adopt one: Sentry.
Hey, but what do you mean with monitoring? We can say a lot of things, but I think that one of the most important is to know which uncaught crashes happens runtime. So I'll keep it simple and I'll explain how to monitor this kind of events -> these are the initial client question! 😜
Sentry has a generous free tier and I'll explain
- how I integrated it in an iOS app
- the problem I found without previous knowledge about crash monitoring
How to connect an app to Sentry
The official docs is well explained for the Installation and Configure part, but there is an option not cited in the docs that help keeps things sorted: environmentproperty of option object
import Sentry

func application(_ application: UIApplication, didFinishLaunchingWithOptions launchOptions: [UIApplication.LaunchOptionsKey: Any]?) -> Bool {
    SentrySDK.start{ options in
        options.environment = "my_env_name"
        //other options
    }
}
Note that I wrote "my_env_name" for the Sentry environment name. What does it mean?
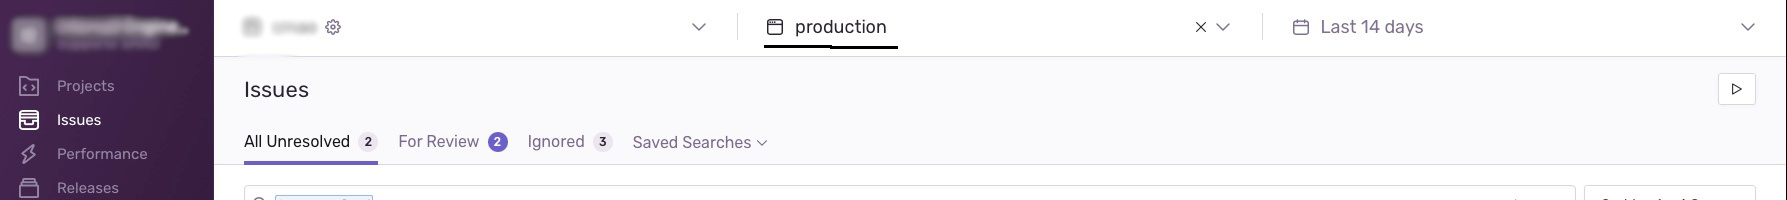
Check out your Sentry console. At the top of the screen there is the environment name. Each name you'll see is not a particular Sentry environment. Each time a log is sent to Sentry with a new options.environment name, Sentry add a new environment to the console, too. You can name the environment with any name. Below you can see my console with issues belonging to the "production" environment (I set options.environment = "production").
Now you've a working environment collecting all non caught runtime crashes with the associated stacktrace! But wait! The stacktrace has something strange 😕
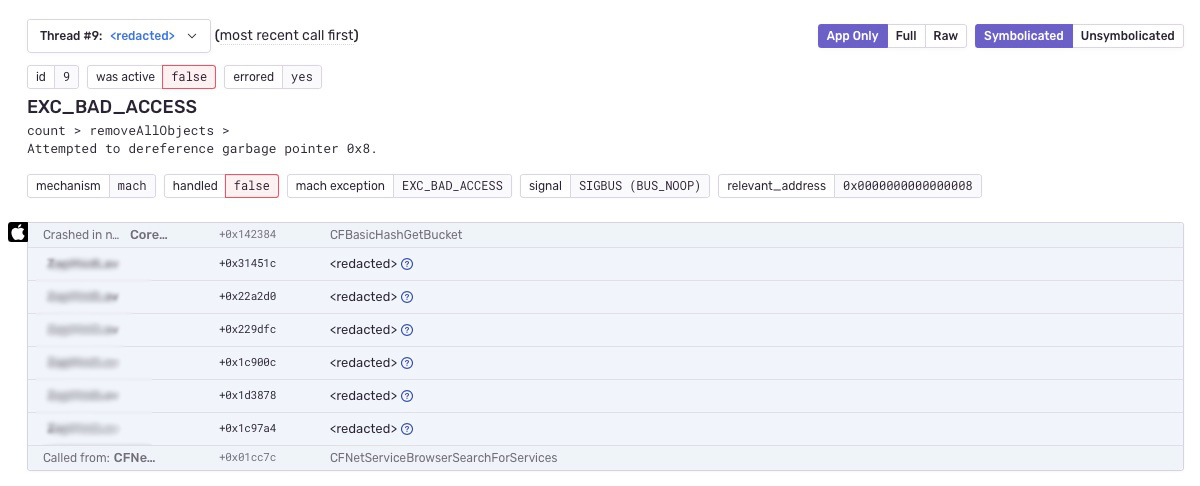
What are the <redacted> near the app name? And why all other system Apple framework's name have a meaningful name (for example see the last line)?
<redacted>is a placeholder that Sentry puts because it doesn't know the dSYMs of your app
"I've never heard about it" you may think. Like me! The docs devotes only 4 rows to this important step and initially I thought it was not important: it worked like a charm and I was more concentrated to see if the crash would arrive to the console from the app. By the way: the crash log are not catched by Sentry if you run the app with an attached debugger: detach debugger from the Debug->Detatch from .... or run the app directly from a device
But what are dSYMs? Simply debug SYMbols, i.e. the app specific parts that contributed to the exception. For security reason the app doesn't send these debug data and when Sentry receives a crash log it doesn't know how to interpret the crash message from the app. These data are instead visible in a debugging session with the cable plugged in the device we're working with.
Ok... Where are they located?
First of all, you must know that dSYMs are tied to a specific build of the app. If you're monitoring the app version 1.0.1 you can't use the dSYMs belonging to the 1.0.0 because each dSYM describes the semantics of each memory location (the stack trace is a list of HEX values) and two different app versions don't share the same memory location in the bitcode
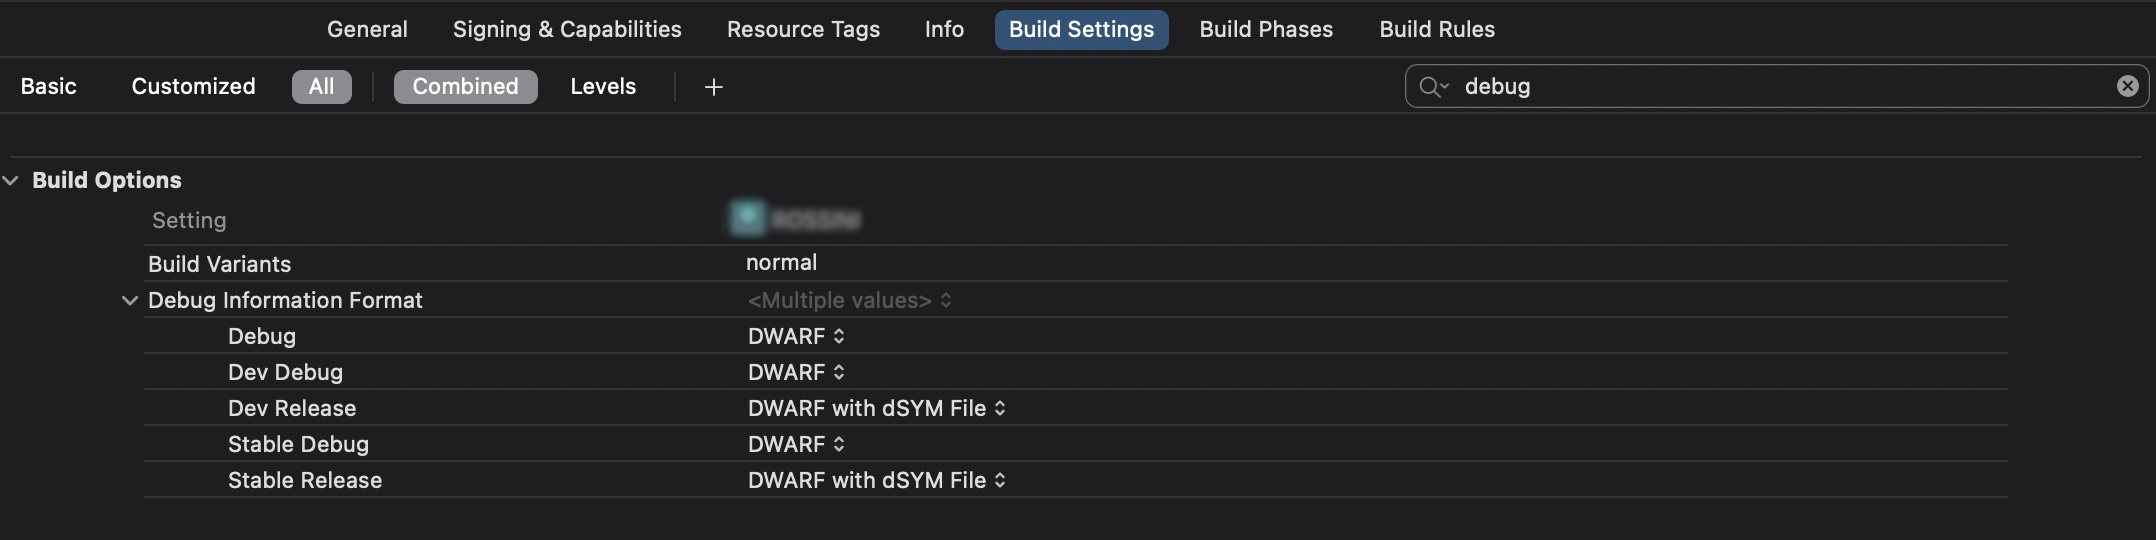
Normally in Xcode the app create dSYM only when we build it in Release mode and you can find it in the DerivedData folder, usually located at /Users/<your_name>/Library/Developer/Xcode/DerivedData/. In this folder you can find a folder named with your app name followed by some characters. If your app name is "MyApp", you could find a folder with a name like "MyApp-dhgdhfgjsghfgshs". Step into that folder and descend the tree until Build/Products/, then you may have a folder with a name like "Release-iphoneos" or whatever, depending which dSYM you've generated during the build (see the screenshot below) and finally in this folder you can find a file (which is a folder practically) with extension .app.dSYM.
 Step into the
 .app.dSYM folder until <your_app_name>.app.dSYM/Contents/Resources/DWARF and you'll find a single file called as your app name. We'll call it "TO_CHECK"
Then run the following command
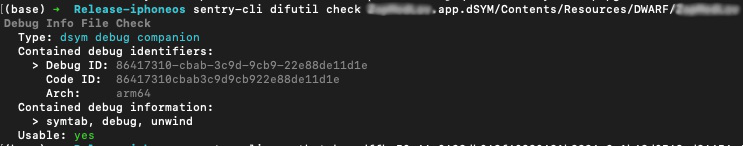
sentry-cli difutil check <path_to TO_CHECK>
This will check if the dSYMs we want to upload to sentry are ok. You should have an output like this.
If you don't have sentry-cli install it
Ok... we've almost end!
Now we actually have to upload the dSYMs of the entire app, including frameworks!
From the docs we can see the command
sentry-cli --auth-token YOUR_AUTH_TOKEN upload-dif --org YOUR_ORG_SLUG --project YOUR_PROJECT_SLUG PATH_TO_DSYMS
"PATH_TO_DSYMS" is plural. How can we upload all the dSYMs in a shot with the certainty of doing everything correctly? We've to upload the .xcarchive file corresponding to the latest build we're monitoring on Sentry.
Ok: where I can find the .xcarchive file?
Go to Xcode -> Window -> Organizer -> Archives. Right click on the release we're dealing with and Show in finder. The archives are usually located at /Users/<your_name>/Library/Developer/Xcode/Archives.
Run the following command:
sentry-cli --auth-token <your_token> upload-dif --org <your_sentry_org_name> --project <your_project_name> --log-level=debug <your_archive>.xcarchive
You should have an output like this

To make sure everything is ok, go to your sentry web console -> Settings -> Projects -> <select the project> -> Debug Files and search the panel "Uploaded debug information files". You should see one or more files uploaded recently with the "Information" column explaining which library (or the app itself) the debug files belongs to.
Ok.... That's all. From now on (it's not retroactive) the <redacted> crashes will disappear and every crash will make more sense!!
Thanks for reading